At Raima we always strive to increase performance in our products. Recently I worked with one of our customers to solve a database performance related problem and discovered some interesting facts. The solution to a database performance problem may require more than just adding additional memory that runs at higher speeds.
Methods of Optimization
In data management there are countless ways to optimize the different operations involved in data storage and retrieval. Many times, optimizations in one area may require tradeoffs in others. A common example of this is increasing insert performance by relaxing the ACID (Atomicity, Consistency, Isolation, Durability) properties in transaction processing. On the positive side you can dramatically increase the numbers of inserts per second. The down side is that you now have greater risk for data loss.
While most attempts to increase performance need some sacrifices, I had always thought that there was one tried and true method to increase database performance across the board – throw hardware at the problem. However, this case has shown me that, in certain situations, adding resources can cut performance – perhaps even dramatically.
Memory Management Details
The customer I am referring to has an application that needs to handle huge bursts of record inserts – perhaps 10 million new records inserted into the database at a time. The application requires persistent storage so a pure in-memory database was not enough and writing the data out to even the fastest drives did not always meet the performance requirements. After doing some analysis with our engineering team it was decided that the short-term resolution for the issue was to run the application on a server that had enough RAM to cache even the largest expected insert burst into cache before committing the transaction and writing to disk. By increasing the total number of cache pages and the size of each page they could fit the largest expected transaction block into about 40 GB of RAM.
Armed with that knowledge they equipped a server with 128 GB of RAM and 16 processor cores. When they ran the application on the new server the results were decidedly underwhelming. Instead of getting a performance boost by utilizing the available resources on the machine the database performance actually dropped; in fact the first test run took so long they finally gave up and killed the process.
In trying to help the customer understand what was going on and to decide whether there was anything in our code, or theirs, that could be done to improve the situation we ran many tests.
Are We Going Virtual?
The first thing we looked at was disk I/O. A common mistake I see from our customer base is requesting more database cache pages than can be handled by the amount of physical memory available for use. This can cause extreme performance degradation as the operating system will begin the virtual memory process by writing it out to disk. While the server in this test case was designed specifically to handle the expected load of the application we wanted to make sure that the operating system was handling the cache as we expected it to. Our analysis showed that there was no more I/O being performed other than what was expected by the operations requested by the application. The available persistent memory was being used and the process was not virtualized.
Can We Handle A Large Number Of Pages?
The next thing we looked at was how we handled our internal database cache. In RDM Server the database cache is used to hold modified portions of the database until a transaction is committed and the change is written to disk. One concern was that our algorithm for looking up cache pages did not scale well enough to handle the very many cache pages requested by this application. Analysis did prove that the hashing algorithm used to lookup pages was just as efficient with large number of pages as with more moderate number of pages that are used in more typical scenarios.
Why Does It Take So Long To Shut Down?
Continued analysis revealed processing inserts in the test runs was progressing in the expected amount of time. However, once insert processing was complete the application was taking hours (instead of seconds) to shut down. Profiling and debugging showed that the unexpected time after the completion of inserts was spent freeing the allocated memory for the cache pages. Each free operation was averaging about 13 milliseconds. With over 2,621,440 cache pages allocated it was calculated that it would take over 5 hours to completely free all the memory. For comparison purposes on a development machine using only 12 GB of cache (1,572,864 8K pages) the entire cache was freed in 3.48 seconds (2 microseconds per free).
To isolate the behavior, a very simple application was created that allocated memory and then freed it in different sized blocks. We ran this test allocating different amounts of memory for various block sizes and charted the results.
Memory Allocation On Window Server 2008 R2 Datacenter
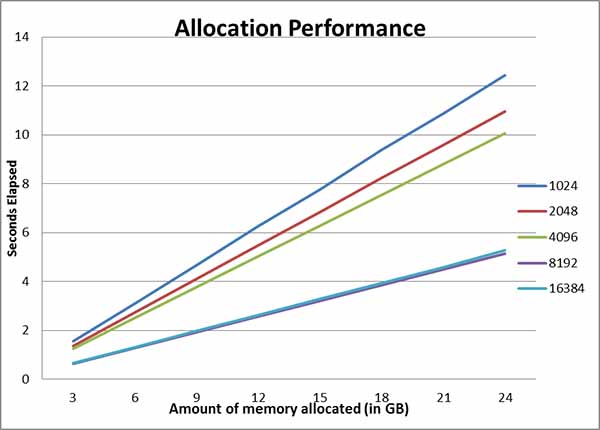
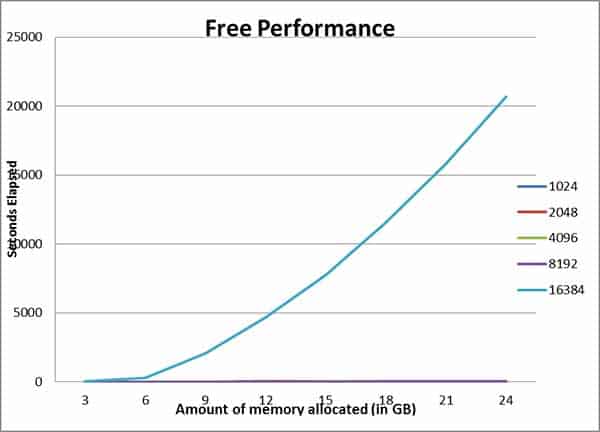
The chart for memory allocation looked as expected. Memory allocation takes more time when using smaller block sizes because there are more allocations required, but the graphs are all linear for the different block sizes. When running/charting the results of freeing memory we found a very different story.
Memory Free On Window Server 2008 R2 Datacenter
What isn’t very easy to see on the chart is that memory free operations are linear for 1K, 2K, 4K, and 8K block sizes. What is very easy to see is that when using a block size of 16K (actually any block larger than 16,343 bytes) freeing memory is not a linear operation, particularly if you are allocating more than 6GB. This behavior was causing the degradation in performance.
Sanity Check
We decided to run the test on a different operating system to confirm our results. We compiled the same source code and ran the binaries on the same hardware (dual-booted to Linux instead of Windows) and got very different results.
Memory Allocation On Linux
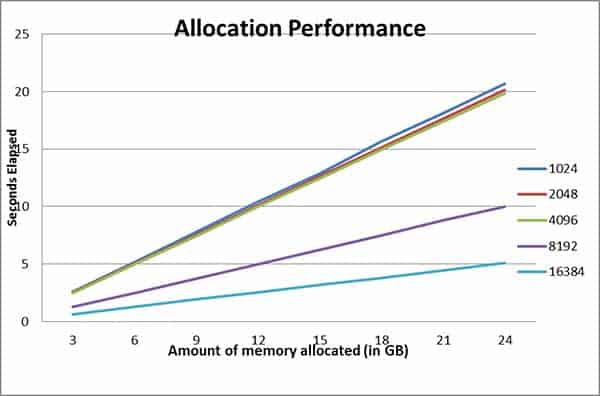
Memory allocation on Linux also had a very nice linear graph, it took a little longer to allocate memory on Linux than Windows, but the results were similar.
Memory Free On Linux
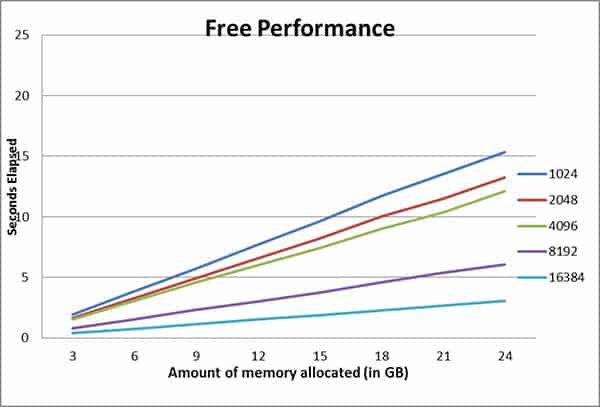
Free memory on Linux was vastly different from what we saw on Windows. The free operations on Linux were much faster and more predictable than what happened on the Windows platform. Linux’s implementation in this respect was more robust and provided better scalability.
What Can Be Done?
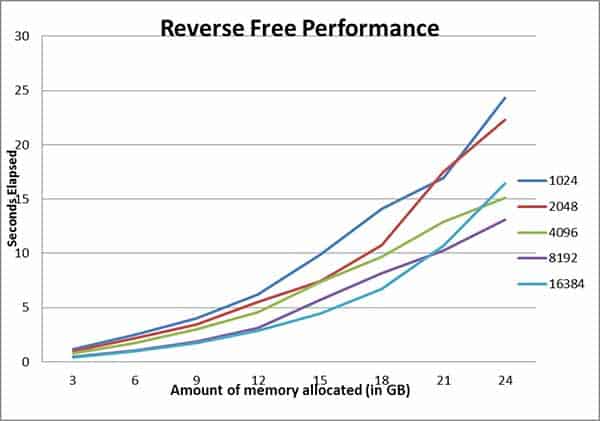
One of the most challenging things about “something that should be fast but isn’t” is figuring out how to make it fast as it should be. We were unable to find much information about this issue through web searches, but we did make one minor change to the test that proved to have good results. The original test allocated memory in the same order it was freed. By modifying the test to free memory in the reverse order, stack instead of a queue, performance was greatly improved on Windows.
Reverse Memory Free On Window Server 2008 R2 Datacenter
While the graph is not completely linear freeing memory in reverse order on Windows allows for completion in seconds instead of hours when using page sizes greater than 16K.
Reverse Memory Free On Linux
Linux also saw a performance increase by free memory in the reverse of how it was allocated, the results were still linear.
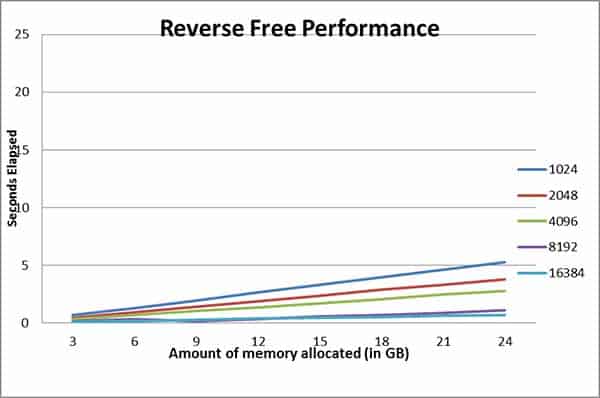
As you can see from the charts, moving to freeing memory in the reverse order had a dramatic increase in performance. Although it is still not nearly the database performance seen on Linux, it is at least tolerable. This was a perfect short-term fix for our customers running on Windows, but we still feel it should run faster.
Can We Replace Malloc/Free With Something Better?
After validating with our customer that the change to free data in reverse order allowed them to run their application we decided to look at some of the alternate malloc implementations provided by Microsoft. There are several alternatives available but many of them are legacy implementations left over from the 16-bit era. The VirtualAlloc/VirtualFree functions seem to be the only viable alternative to malloc/free. These Virtual memory functions provide functionality beyond what is available with the basic malloc/free, but with the correct options you can use those functions as a viable replacement for malloc/free.
We modified our test code to replace the call to malloc with the following:
p = (MEM_CHUNK *)VirtualAlloc(NULL, chunk_size, MEM_COMMIT | MEM_RESERVE, PAGE_READWRITE);
Calls to free were replaced with:
VirtualFree(p, 0, MEM_RELEASE);
We then ran the test application to allocate 24GB of memory in 1K chunks and the results were…not very good.
The machine we ran our tests on has 64 GB of memory and the largest amount of memory we were expecting to allocate in a test run was 24 GB. However, after our test run failed to complete in several hours we noticed that performance monitor showed our test process had all 64GB of memory in use. This is easily explained by carefully reading VirtualAlloc documentation. The smallest allocation size of VirtualAlloc is a single memory page. On our machine the memory page was sized at 4K so all of our 1K memory requests were actually reserving 4K. At the upper limits of our test we would be requesting 96 GB of memory on a system that had only 64 GB available. A few test modifications to remove test runs for page sizes less than 4K gave us the results we were hoping for.
VirtualAlloc On Window Server 2008 R2 Datacenter
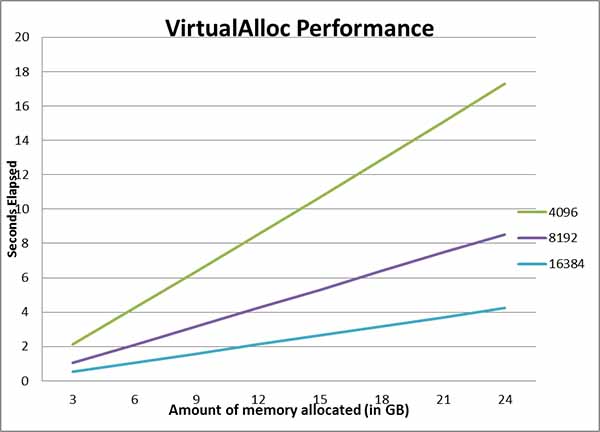
VirtualAlloc did not perform as well as malloc for smaller page sizes, but for page sizes larger than 16K it out performed malloc.
VirtualFree On Windows Server 2008 R2 Datacenter
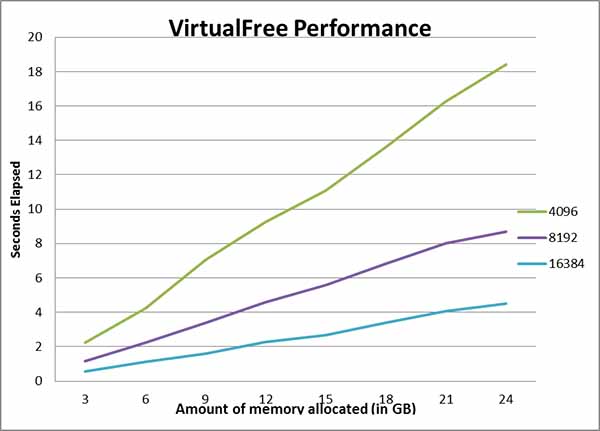
VirtualFree outperformed free across the board, especially with page sizes larger than 16K.
Reverse VirtualFree On Windows Server 2008 R2 Datacenter
VirtualAlloc had similar performance independent of the order memory was freed. It outperformed malloc for page sizes larger than 8K.
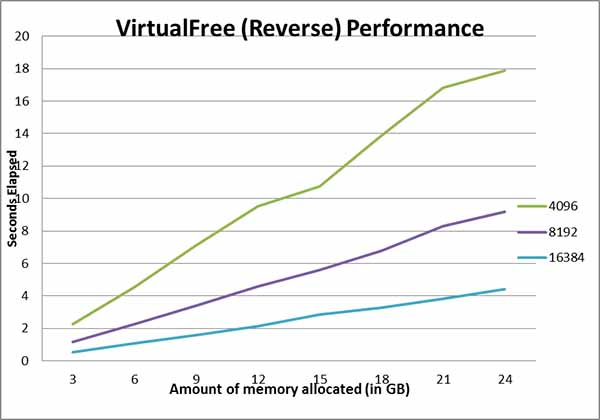
The great thing about the VirtualAlloc/VirtualFree results is that database performance remains consistent regardless of the order that memory is freed. By modifying our code to use VirtualAlloc for allocating buffers larger than 16K we can improve the performance and predictability on Windows-based systems.
Conclusion
If you have an application that uses a lot of memory allocation in relatively small chunks, you may want to consider using alternatives to malloc/free on Windows-based systems. While VirtualAlloc/VirtualFree are not appropriate for allocating less than a memory page they can greatly improve database performance and predictability when allocating memory in multiples of a single page.
It is always nice when things that should be fast actually are.


